Articles of Interest
Integrating ESG Risk Analysis Into A Macro Investment Strategy

1. Summary
- Integration of Environmental, Social, and Governance (ESG) risk factors into investment processes is increasingly common for strategies that select across individual securities, including public equities and bonds, and private assets.
- Rigorous ESG integration is less common for top-down absolute return macro strategies that invest on the basis of an analysis of country level fundamentals. We demonstrate our approach to ESG integration in the context of the CIBC AM Active Currency investment strategy.
- Our dynamic macro ESG scoring methodology encompasses distinct E, S, and G quantitative factors, and complementary forward-looking qualitative country analysis. This approach facilitates a continuous robust assessment and integration of ESG risks into Active Currency portfolio construction and positioning.
2. Introduction
Explicit recognition of ESG risk factors is increasingly common. Recognition is sometimes motivated by a shift in investor values in favor of investments that promote achievement of a particular value set, often in preference to maximization of risk-adjusted returns (Riedl & Smeets, 2017).
In other instances, recognition of ESG risk factors reflects a desire to maximize the breadth of investment processes and ensure that all relevant risks are integrated and rigorously appraised within asset allocation frameworks. This ensures that portfolios are continuously exposed to those opportunities with the highest accompanying risk-adjusted expected returns.
At CIBC Asset Management (CIBC AM), we have a fiduciary responsibility to our clients to consider all relevant risks in the context of rigorous investment research and portfolio construction. Including a broad array of identified ESG risk factors into our investment decision-making processes, alongside more traditional risk factors, enhances the long-term expected performance of investment portfolios and improves expected risk-adjusted outcomes for our investors. It is also consistent with CIBC’s commitment as a signatory to the United Nations-supported Principles for Responsible Investment (PRI).[2]
3. Incorporating ESG into investment decision-making
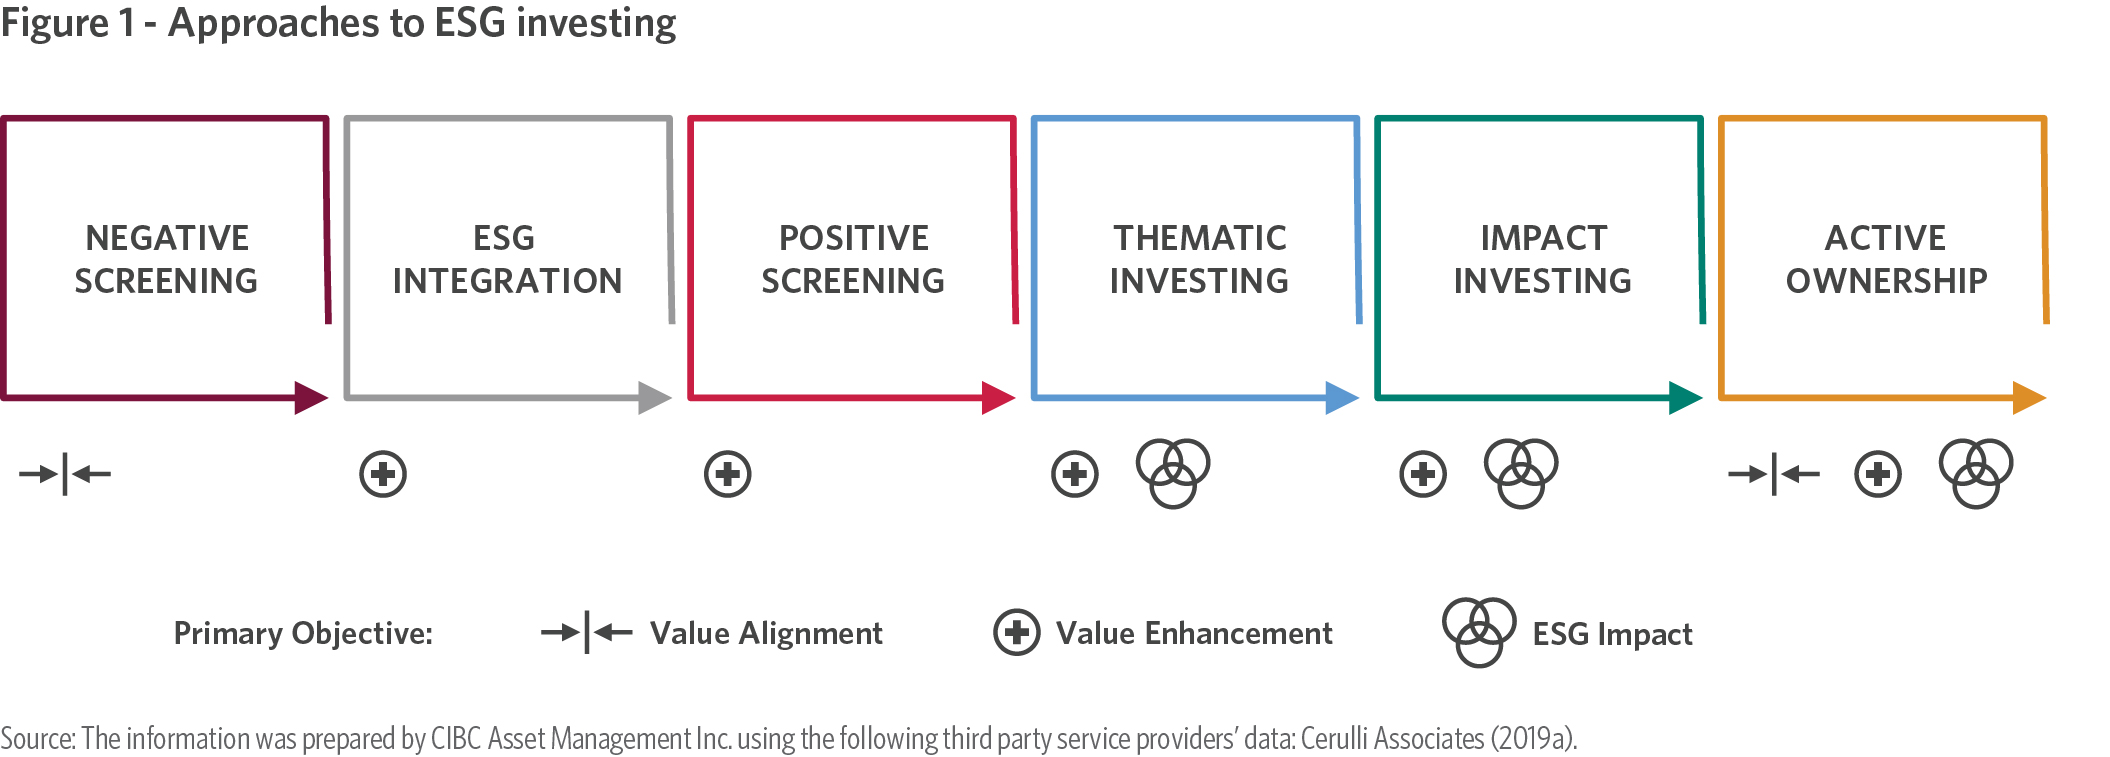
Survey data indicate a majority of investors believe explicit assimilation of ESG risk analysis into investment decision- making can help reduce portfolio risk. And an increasing number of investors expect ESG-integrated portfolios to generate higher returns than portfolios that do not integrate relevant ESG risks (Man Institute, 2020; Deutsche Bank, 2021). We concur on both points. We can identify six ways investors have sought to incorporate ESG analysis into investment processes. These include Integration, positive and negative screening, and close relatives thematic and impact investing (Figure 1).
The CIBC AM Active Currency, and broad macro, approach to ESG focuses on Integration. We are not alone (McKinsey, 2020, Schroders, 2020; Figure 2).
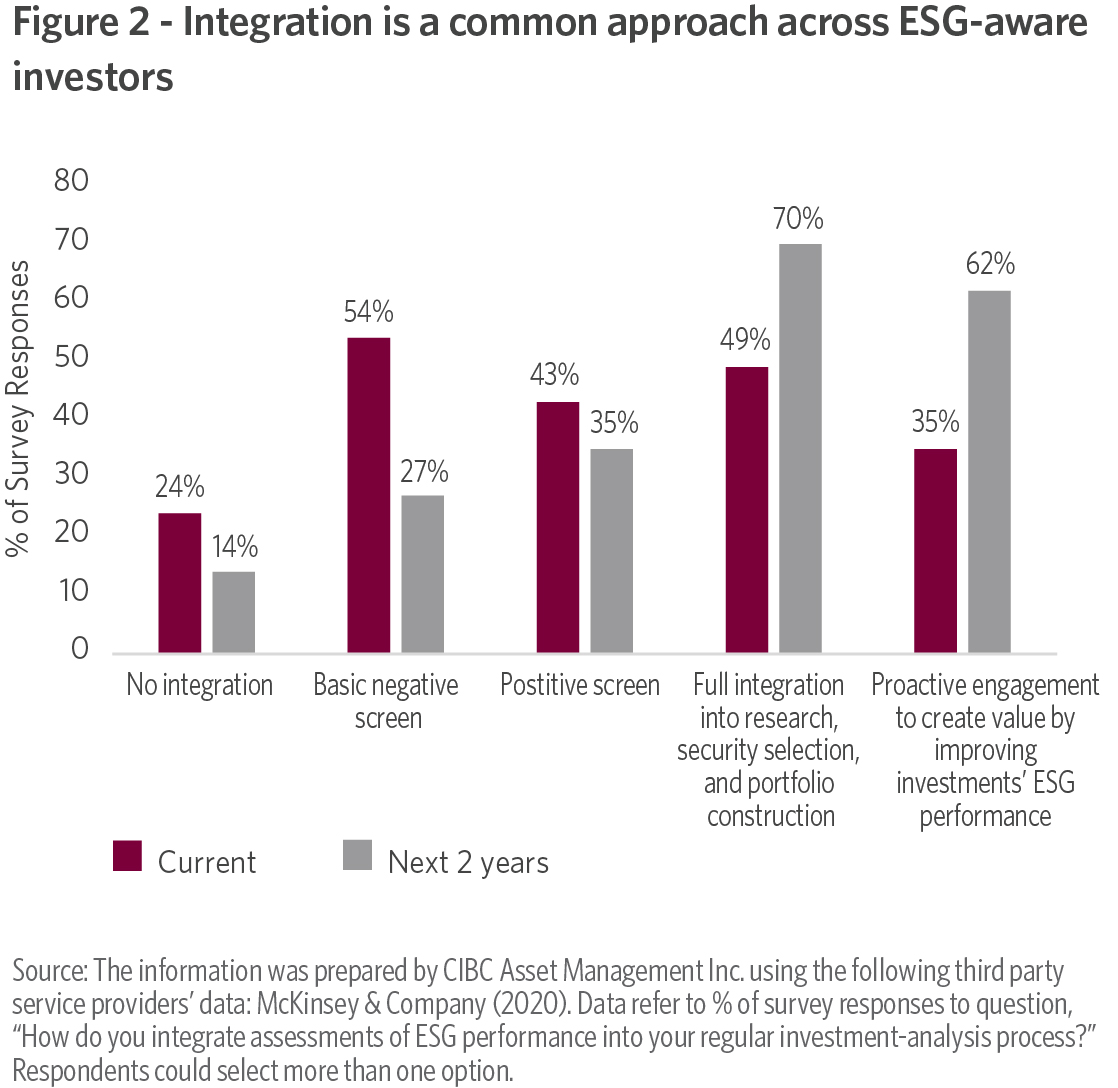
The focus of ESG Integration is to ensure all relevant risks— traditional and non-traditional—are thoroughly assimilated into investment decision-making and portfolio construction, as a means to maximize risk-adjusted expected performance. In an Integrated approach, a manager may hold an asset ranked poorly on ESG considerations if other attributes of that investment, including expected return, compensate for its inferior ESG profile. Unlike Screening, no asset is ex ante excluded (Dunn et. al., 2020).[3] And there is no presumption that portfolio exposures will persistently favour higher-ranked ESG assets; for many asset classes, this approach could be deleterious to expected performance, as it would likely favor low yield assets.
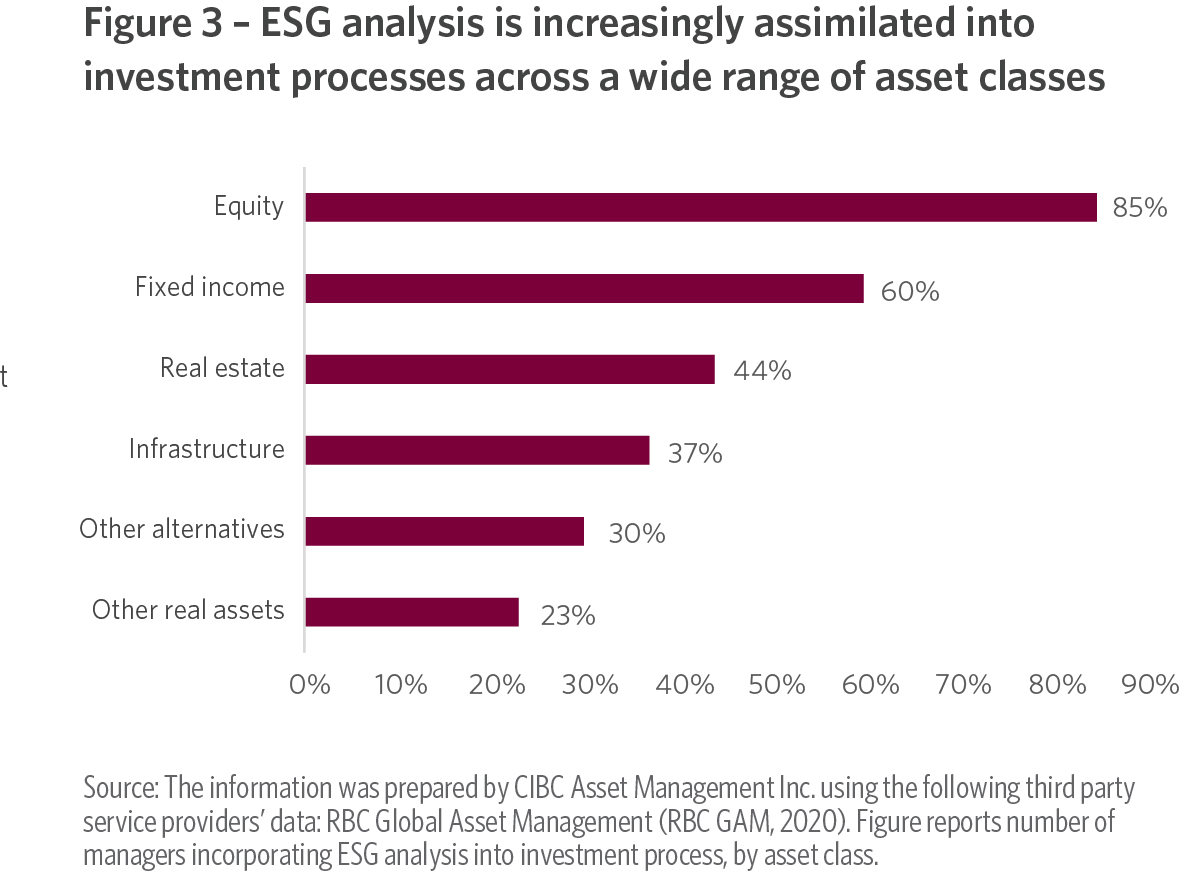
ESG Integration is most common for bottom-up equity and fixed income security selection strategies (Figure 3).
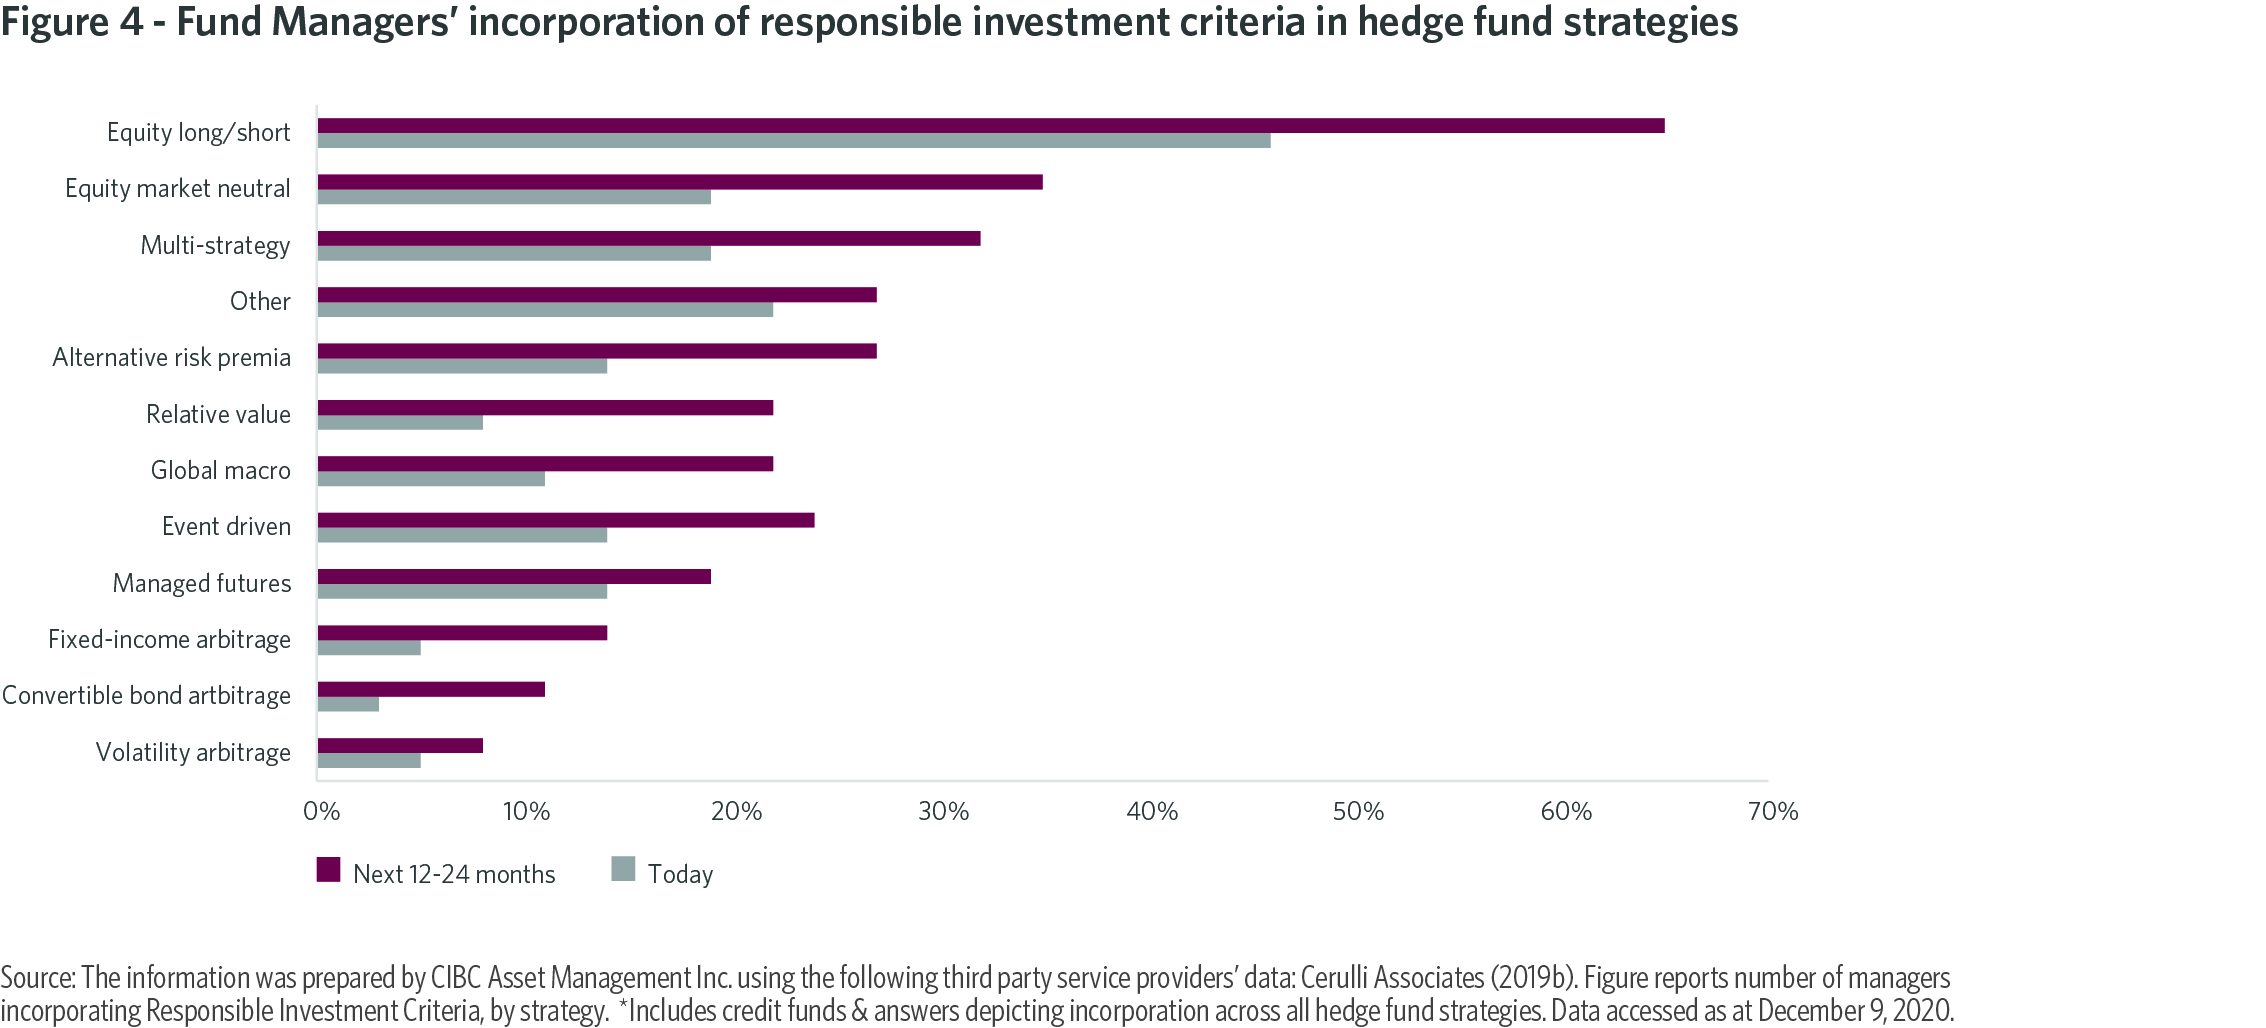
A bottom-up focus is also prevalent within Alternatives, including across various absolute return investment strategies (Figure 4). Less common is ESG Integration into a top-down global macro investment process (Man Institute, 2020). This is the focus of our efforts.
We apply our top-down macro ESG-aware process to the existing CIBC AM Active Currency investment universe of 34 Developed (DM) and Emerging Market (EM) currencies.
Currency returns can largely be captured using a set of well-established, persistent risk factors, or premiums, including Value, Carry, Momentum, and Cycle. These factors compensate investors willing to accept exposure to particular risks and behavioral anomalies. They explain returns over different investment horizons, and exhibit low or negative correlation to one another over extended sample periods.
We now formally integrate ESG into this list of risk factors. This is eminently feasible. Many identified S and G risk factors—for instance, related to education standards and access, and rule of law, political stability and institutional strength—have long been explicitly considered within our investment process, from a rigorous qualitative perspective. We consider them to be significant determinants of returns.
There are many examples of this significance. We highlight four. First, the behavior of the Turkish lira (TRY) in recent years—and our strategy decisions with respect to this currency—has been dominated by governance issues. Second, the appreciation of the Euro from May to December 2020 can partly be attributed to the introduction of the European Recovery Fund. This announcement was a key factor in our decision last year to reduce and then close a long-standing Euro short position; in our opinion, it represents the first step towards a centralized European fiscal authority whose absence has long been considered the Euro’s Achilles Heel.
Third, a key determinant of the pace and extent of further renminbi internationalization will be the perceived quality of Chinese domestic institutions and legal structures (Figure 5). These remain relatively weak, and currently discourage wider use of the renminbi, including in non-Chinese trade.
And fourth, productivity, and attendant social factors, has long been identified as a key determinant of cross-border capital flows and expected currency returns. It is an integral component of currency Fair Value frameworks.
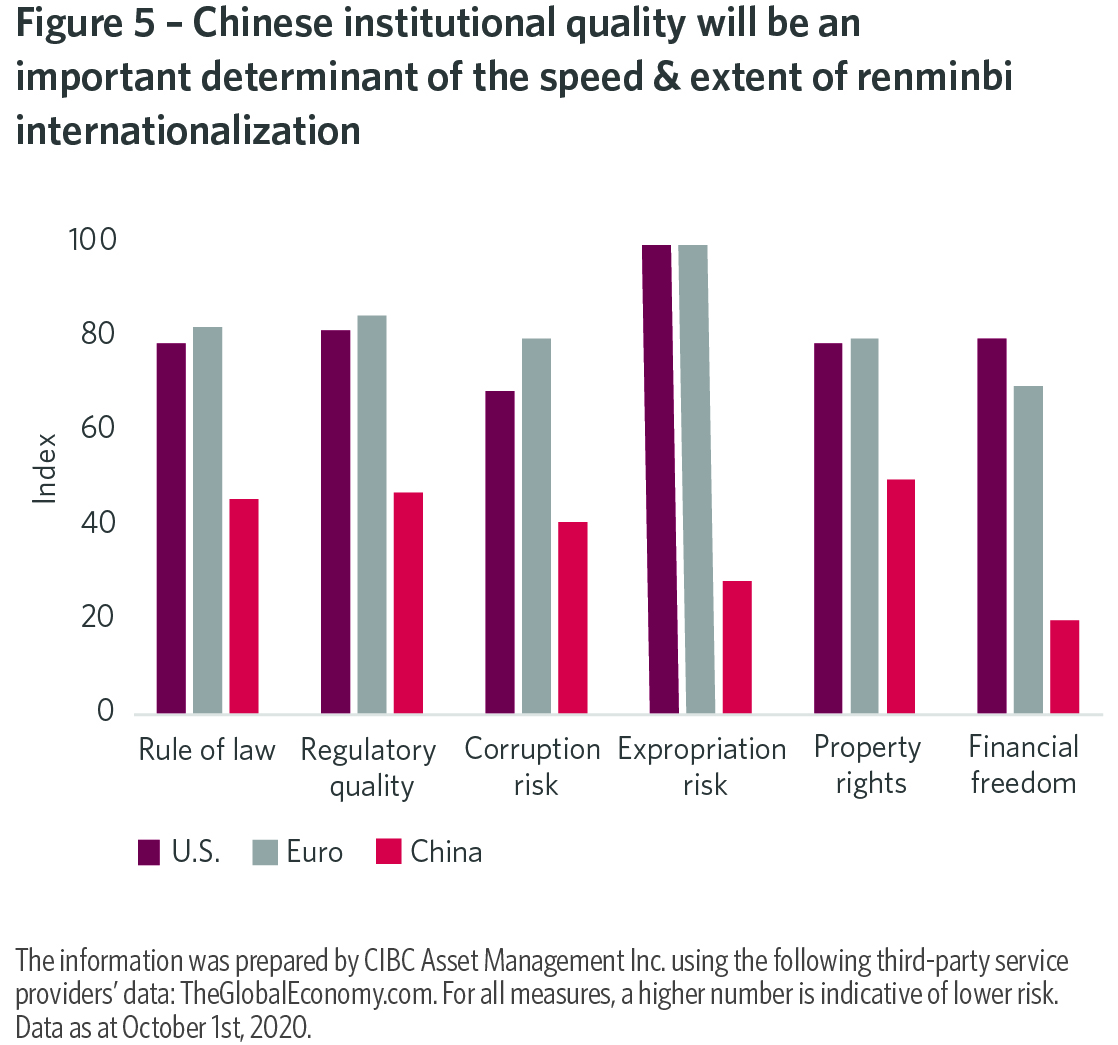
Inclusion of E risk factors is more innovative in a macro context, but resonates with our focus on long-term fundamental determinants of asset returns. Climate change will likely exert an increasingly significant impact upon economic development and growth, and therefore asset returns, in coming years.
Formal integration of ESG-aware risk analysis does not change the fundamental tenets of our existing macro investment philosophy or process. These tenets will continue to integrate rigorous foundational quantitative models with top-down forward-looking fundamental judgment (Figure 6). This integration has proven robust and diversifying, and has resulted in a coherent investment process that has performed well across many different macroeconomic, market risk, and geo-political environments. It will be enhanced further by a formal inclusion of additional ESG-aware analysis.
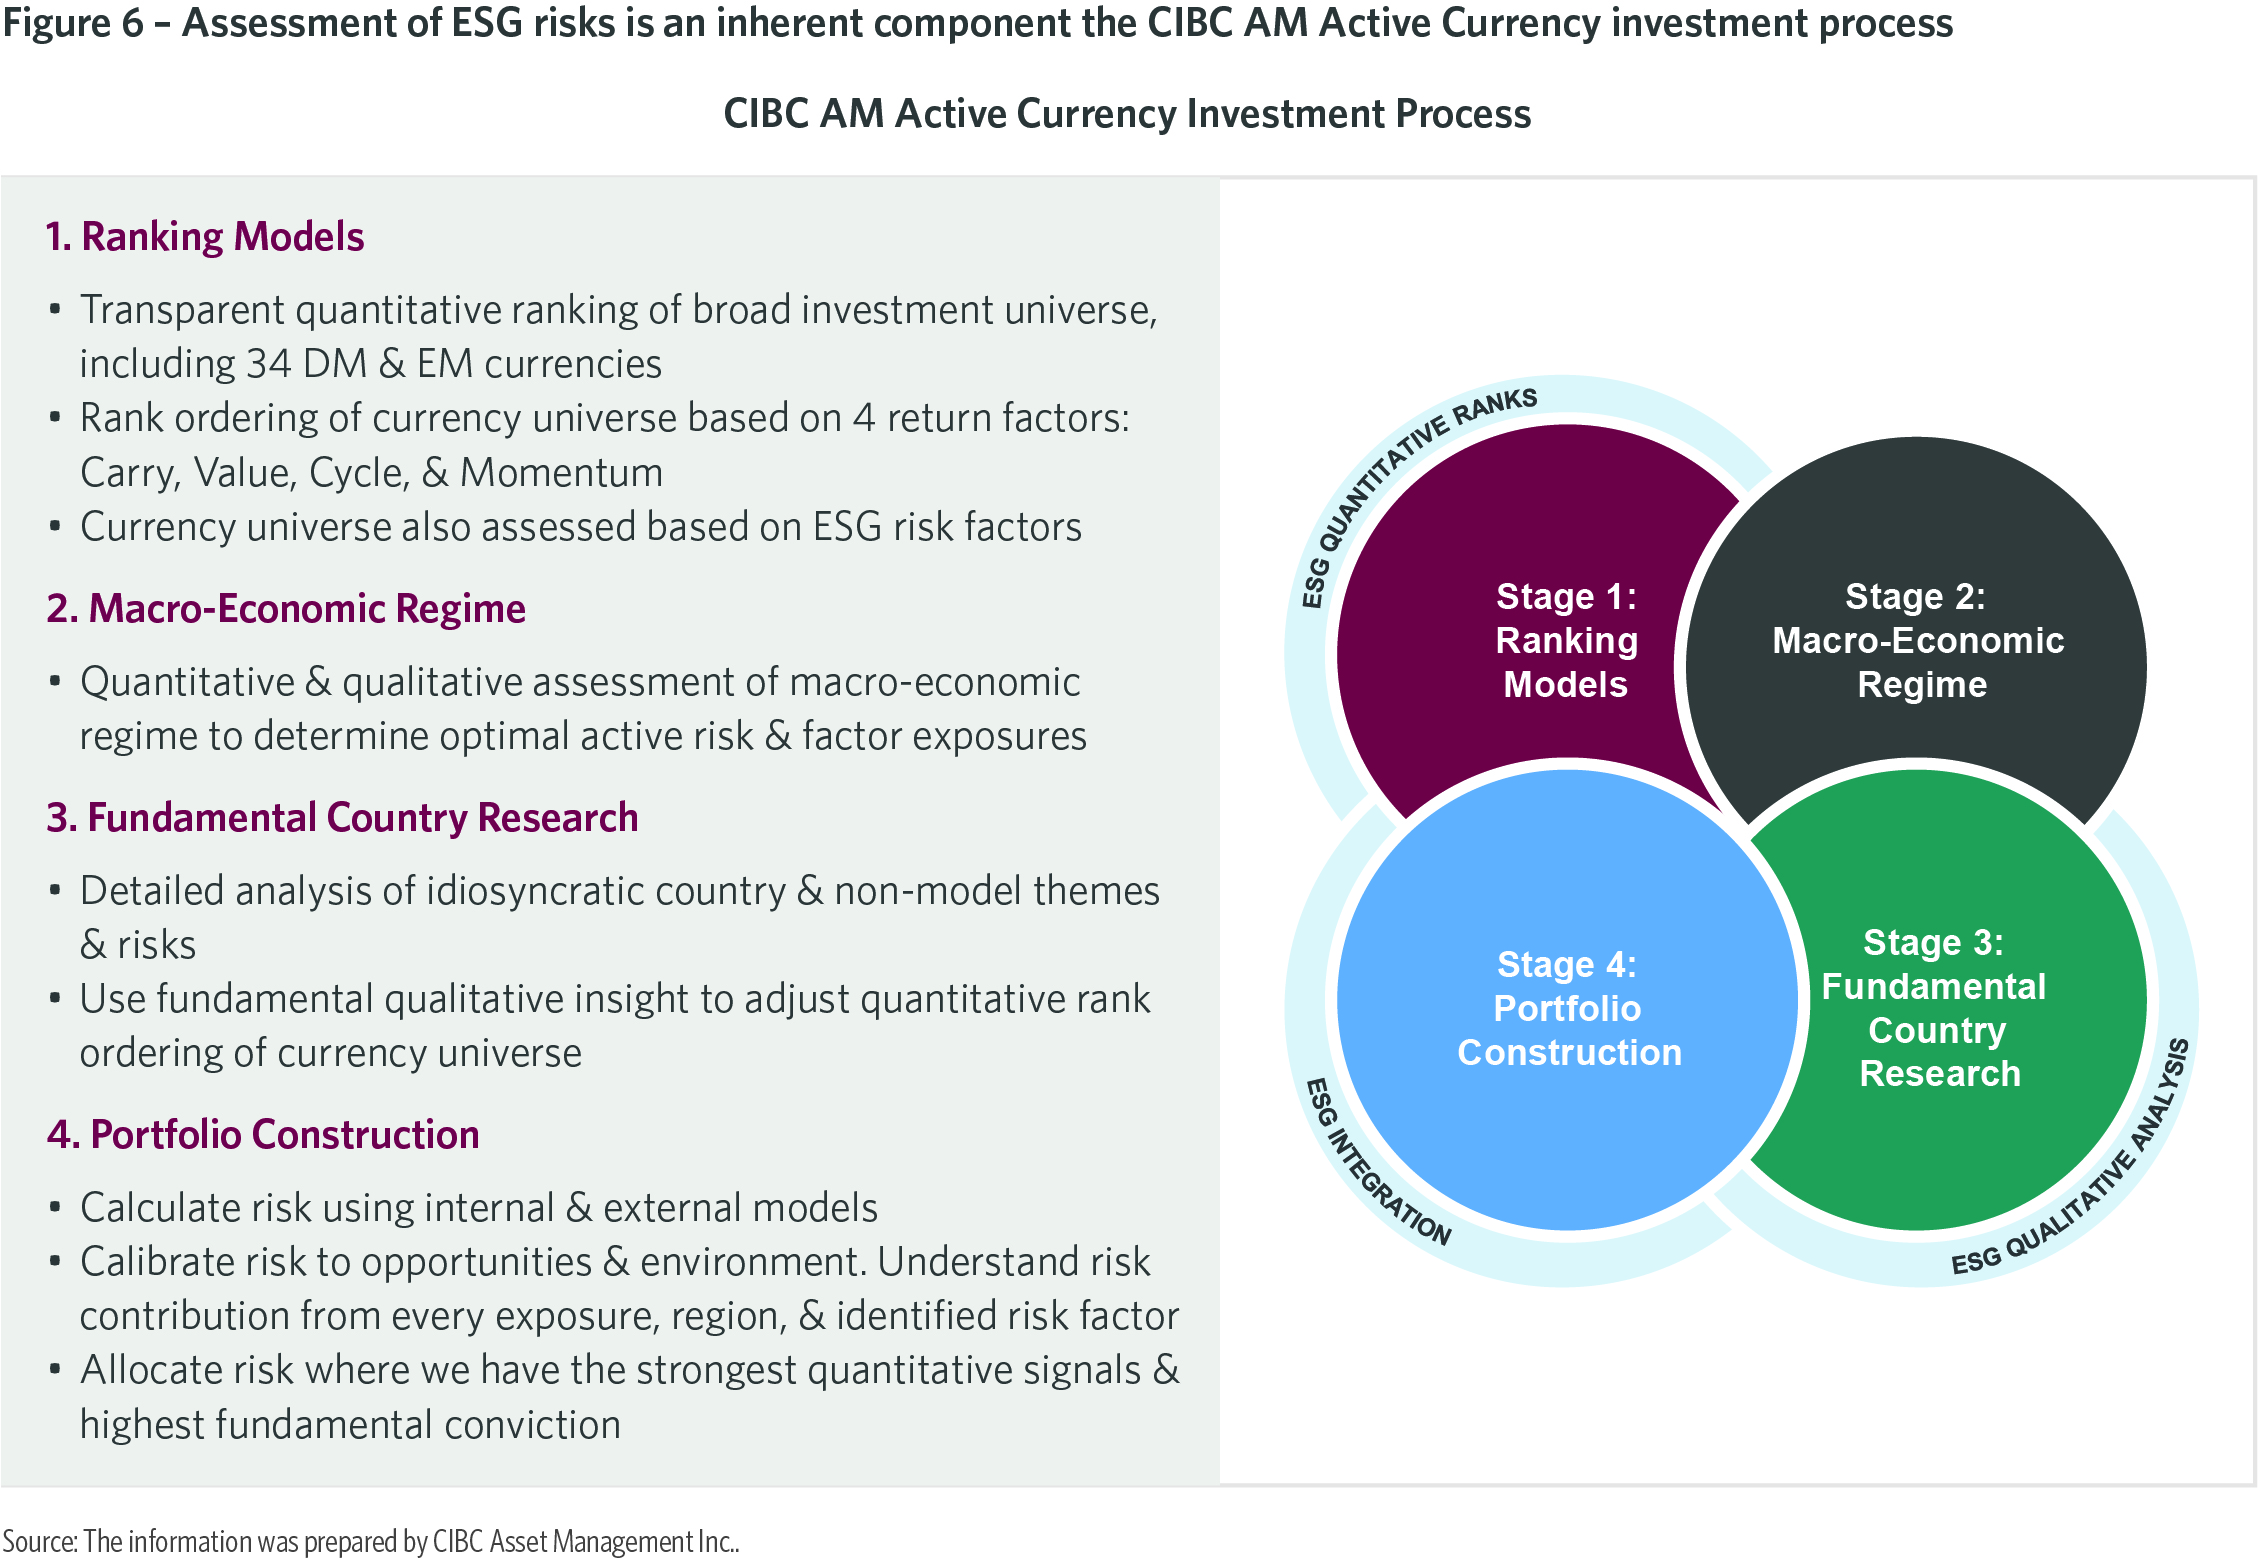
Forward-looking judgment is particularly pertinent to a rigorous assessment of ESG risks and opportunities. This assessment requires an understanding of the long-term impact on capital flows and asset returns of policy initiatives implemented today, and of increasing investor preference in favor of assets with higher ESG ratings.
To give just one example relevant to our absolute return Active Currency strategy, a significant change is expected in the demand for copper due to the gathering global response to climate change. Copper is used extensively in wind and solar projects, as well as electric vehicle charging networks.[4]
The price of a number of assets will be impacted by the prospective change in copper demand/supply dynamics, including the Chilean peso, Peruvian new sol, and South African rand. Quantitative models built to project the behavior of these currencies typically rely upon historical demand/ supply relationships, and assume these will persist into the future. In response to many ESG innovations, these models will be unsighted and prone to persistent and significant error. Forward-looking qualitative judgment can provide analytical depth and context that systematic models by design often overlook (Goldman Sachs, 2020).
Mapping ESG risk factors to measurable indicators
Formal integration of ESG risk factors into an investment process is confronted by a number of hurdles. The first is definitional. For risk factors such as Value and Carry, the extent of definitional disagreement across academia and within the investment community is relatively narrow. For ESG risk factors, it is wide.
To motivate our analysis, we adopt ESG risk factors identified by the California State Teachers’ Retirement System (CalSTRS, 2020; Figure 7).[5] By utilizing an independently identified and well-established set of risk factors, we minimize the risk of data mining that may afflict less rigorous approaches to ESG integration, as well as factor investing more broadly.
The second hurdle is parameterization. To render ESG—along with more traditional economic and financial—risk factors investible, they have to be mapped to identified indicators for which data are readily available for all the countries in our investment universe. This mapping, and all related analysis, is performed in-house within the CIBC AM Multi-Asset and Currency Management team. Maintaining control of data construction affords team members a level of granularity, insight, and perspective that would not be realizable with reliance on third-party providers. Our list of indicators is also included in Figure 7.

The third hurdle is data quality. The correlation of data across third-party vendors for the same group of E, S, and G indicators is often low, for instance due to differences in collection and aggregation methodologies (Bender et. al., 2017; AQR, 2019; Bannier et. al. 2019; Boffo & Patalano, 2020).[6] Performing our own proprietary mapping using data from highly reliable sources—for instance, the World Bank, the OECD, the Bank for International Settlements, and the United Nations—minimizes noise in our ESG risk assessment process.
Calculating ESG scores
Our quantitative framework scores countries against each individual ESG indicator on a scale ranging from zero (lowest, or least compliant) to ten (highest, and most compliant). We use annual observations for each indicator, beginning in 1999.
Individual indicator scores are combined into a single quantitative country ESG score using a proprietary weighting scheme that allocates relatively more weight to the most forward-looking indicators. The latest quantitative cross- sectional ESG ranking of our investment universe is reported in Figure 8. Top ranking currently goes to Switzerland, with an aggregate score of 8.4; the lowest ranked country is India, at 1.7. This ranking reflects a broad spectrum of risks. Several interesting trends are apparent.
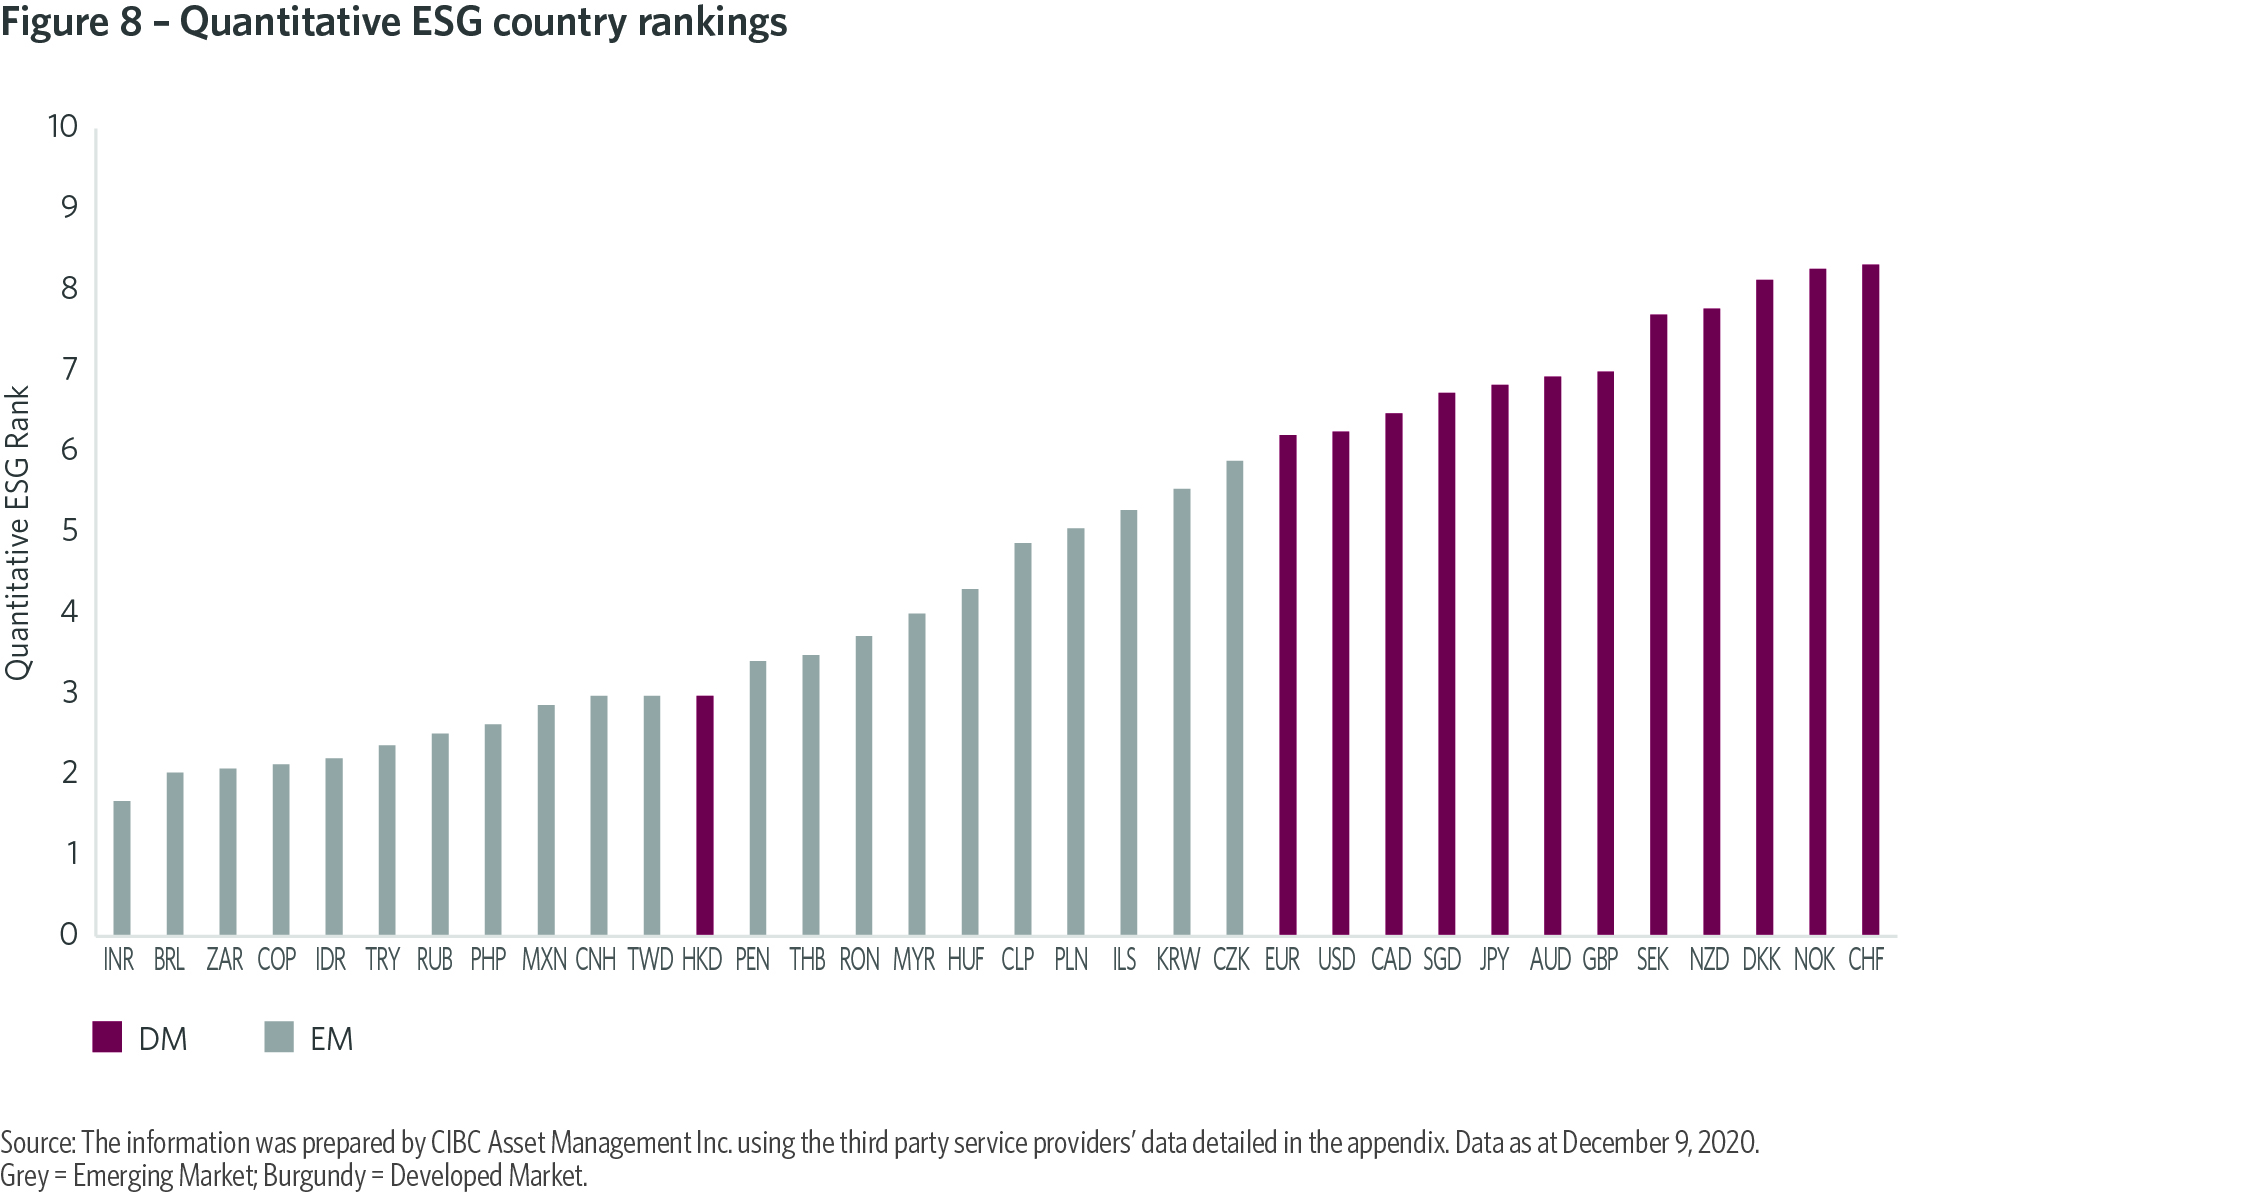
First, and as expected, there is a clear income demarcation within our cross-sectional ESG ranking; the bottom half of the distribution is dominated by Emerging Market countries; Developed countries are clustered in the top half. Relatively poorer countries have ostensibly been less able to mitigate climate change or to improve and enforce worker’s rights and institutional governance, perhaps due to a relative lack of financial resources to achieve the same ESG standards as DM countries, allied in some cases to less comprehensive reporting and enforcement.
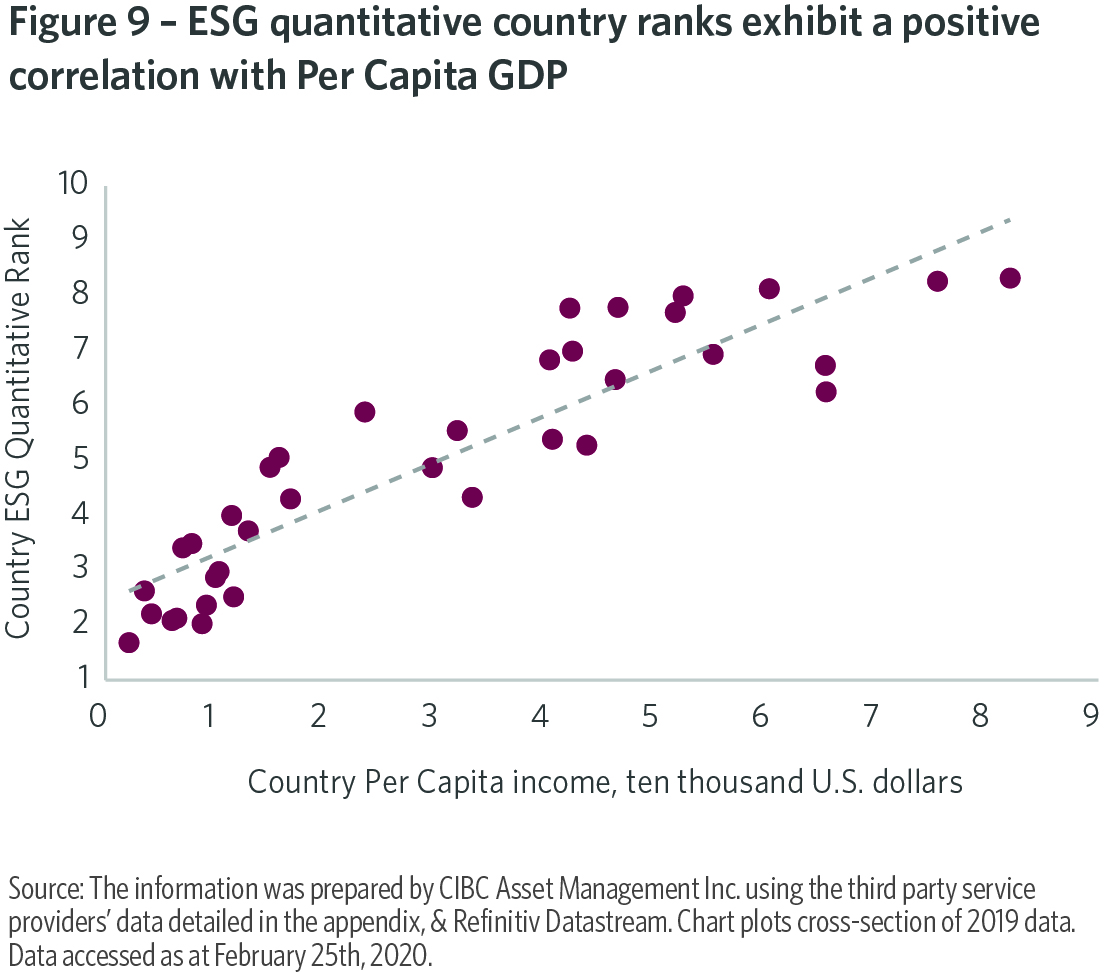
This demarcation is also apparent from a cross-sectional regression of quantitative ESG scores on Per Capita GDP (Figure 9). It will be important to monitor whether this delineation lessens in coming years, as the focus of governments and investors on ESG risk factors continues to sharpen.
Second, the median country Governance risk factor score is appreciably higher than either Environmental or Social risk factor median scores. By implication, Environmental and Social factors offer the greatest scope for improvement in the future. To this end, the time variance of scores is highest for Environmental risk factors, with Social and, particularly, Governance factors exhibiting relatively more stability.
Third, our cross-sectional country ranking is updated formally on a quarterly basis. It changes relatively little from one quarter to the next. This is intuitive. Data innovations for each E, S, and G indicator are published only once a year, although not at the same time for all indicators.
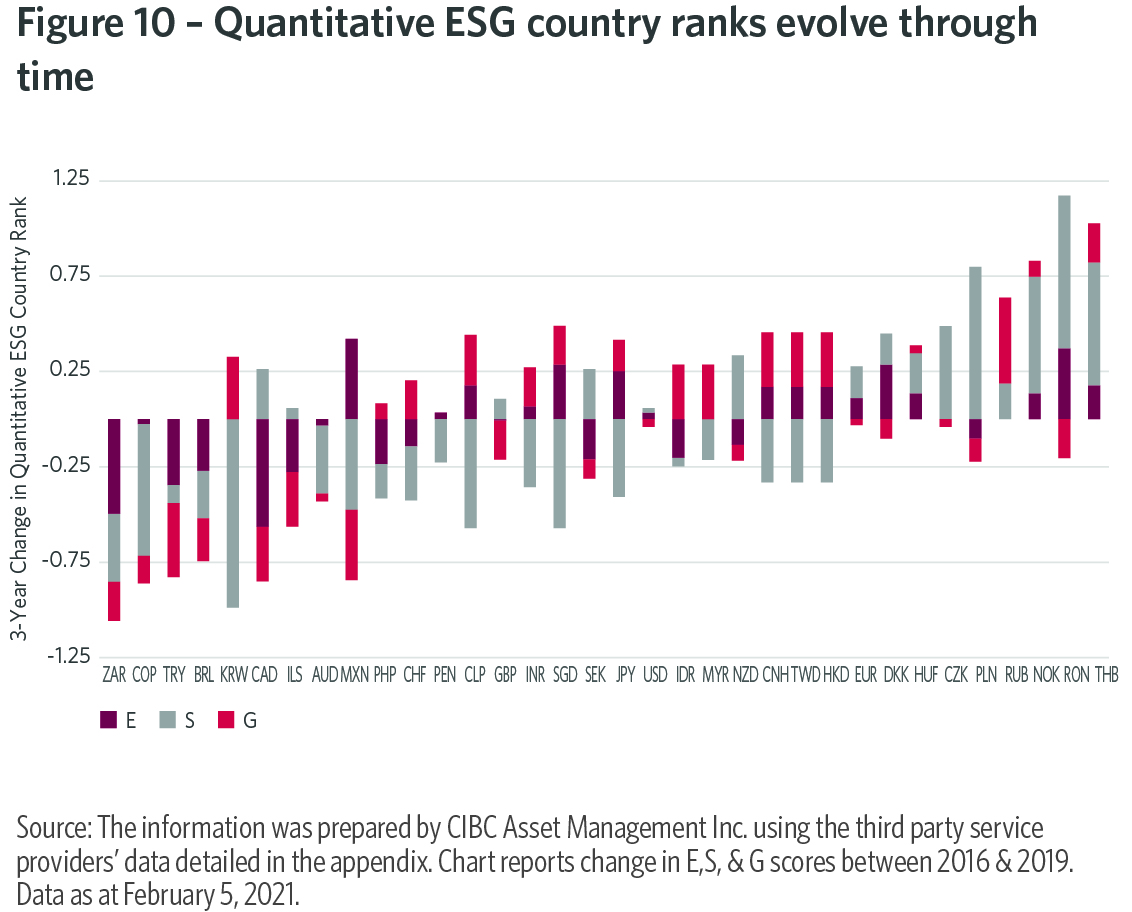
Despite this stickiness, our country ESG ranking does exhibit a degree of dynamism (Figure 10). This is important, as we pay particular attention in our Active Currency investment process to changes in identified risk factors, in addition to their levels.
From Figure 10, there is a less clear income demarcation in the change in country ranks; during the last three years of our sample period, the largest changes are distributed across geographic regions and include a mix of EM and DM countries. Countries experiencing the biggest ranking improvement include:
- Thailand, due to an improvement in female labor market participation and a declining gender wage gap;
- Romania, due to a reduction in the rate of youth unemployment resulting from increasing integration with Europe and improvement in its labor freedom index; and
- Norway, reflecting labor market reforms implemented in the midst of the 2016 oil price collapse that have enabled higher labor market freedom, and an improved aggregate Social ranking.
Countries experiencing the largest 3-year deterioration in ESG ranking include South Africa—for instance, reflecting rising youth unemployment and low female labor market participation—and Canada. In this case, deterioration reflects a decline in both Environmental and Governance risk factor scores, only partially offset by an improvement in Social score. Federal government support for pipeline projects has reduced the country’s ability to meet international carbon emission standards. And recently introduced legislative changes have reduced the ease of doing business in Canada, triggering a deterioration in regulatory quality.
Fundamental analysis
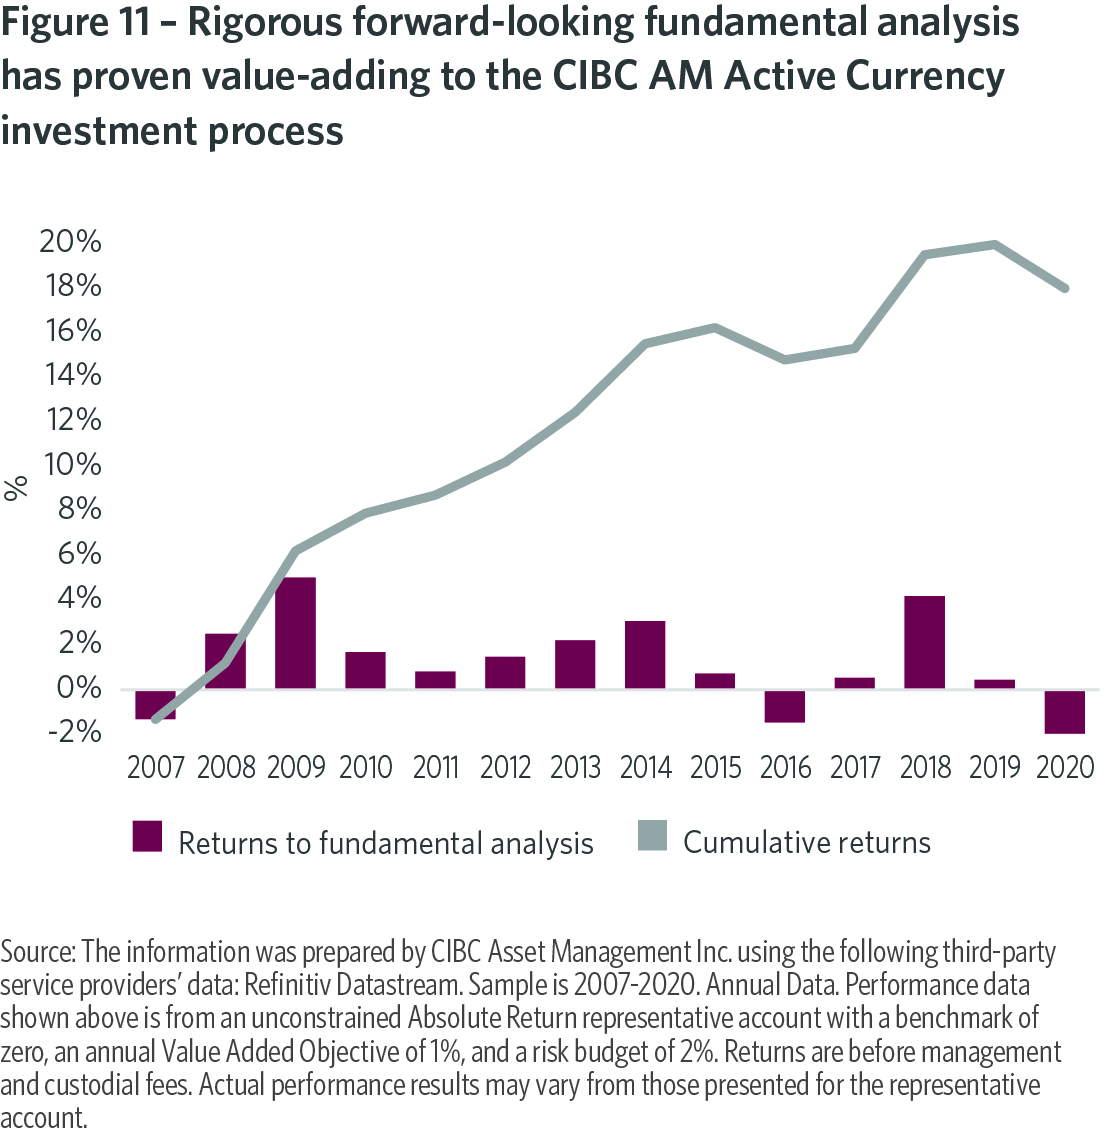
Consistent with all inputs to our top-down macro Active Currency investment process, ESG quantitative scores are adjusted, where appropriate, to accommodate the forward- looking insights of our team of fundamental analysts. Forward- looking fundamental analysis has proven additive to our investment processes over an extended period (Figure 11). An important component of this additivity has been a continuous informal assessment of ESG risk factors. Formalization of this analysis in our investment process is expected to underscore this additivity.
Portfolio construction
A truly integrated ESG investment process encompasses two components. So far, we have focused on the first rigorous analysis and risk assessment. The second component— portfolio construction—is just as important. ESG scores are integrated with other inputs at this, fourth stage of the CIBC AM Active Currency investment process. Here, the portfolio management team maintains a thorough understanding of the motivating investment hypothesis, and associated risk contribution and expected return of every individual currency exposure, regional and thematic exposure, and risk factor— including E, S, and G—in the portfolio. The team ensures that total active risk is consistent with aggregate investment conviction and perform regular scenario analyses to identify potential tail risks to the portfolio. And we continuously monitor the liquidity cost of the portfolio;[7] across assets with similar risk-adjusted expected returns, portfolio exposures are tilted towards higher liquidity—and implicitly higher ESG- rated—assets during periods of heightened market stress.
4. Assessing the predictive ability of quantitative ESG scores
Our investment universe encompasses middle and high income countries. This suggests a higher probability of finding significant relationships between ESG ratings and asset returns than for a universe dominated by lower income countries, for at least two reasons. First, countries with higher Per Capita income have more resources to invest in strategies to improve ESG ratings. Second, ESG reporting tends to be more comprehensive for higher income countries, in the same way corporate disclosure is typically more comprehensive for larger firms and specific geographies (Goldman Sachs, 2020).
To examine this notion, we consider the relationship between ESG quantitative scores and currency returns. We then consider the relationship of these scores with economic risk factors, including Value and Carry. For expositional ease, we exclude from this analysis the impact of our team’s forward- looking fundamental analysis, but emphasize its importance to our overall investment process decision-making and expected returns.
ESG ranks & currency returns
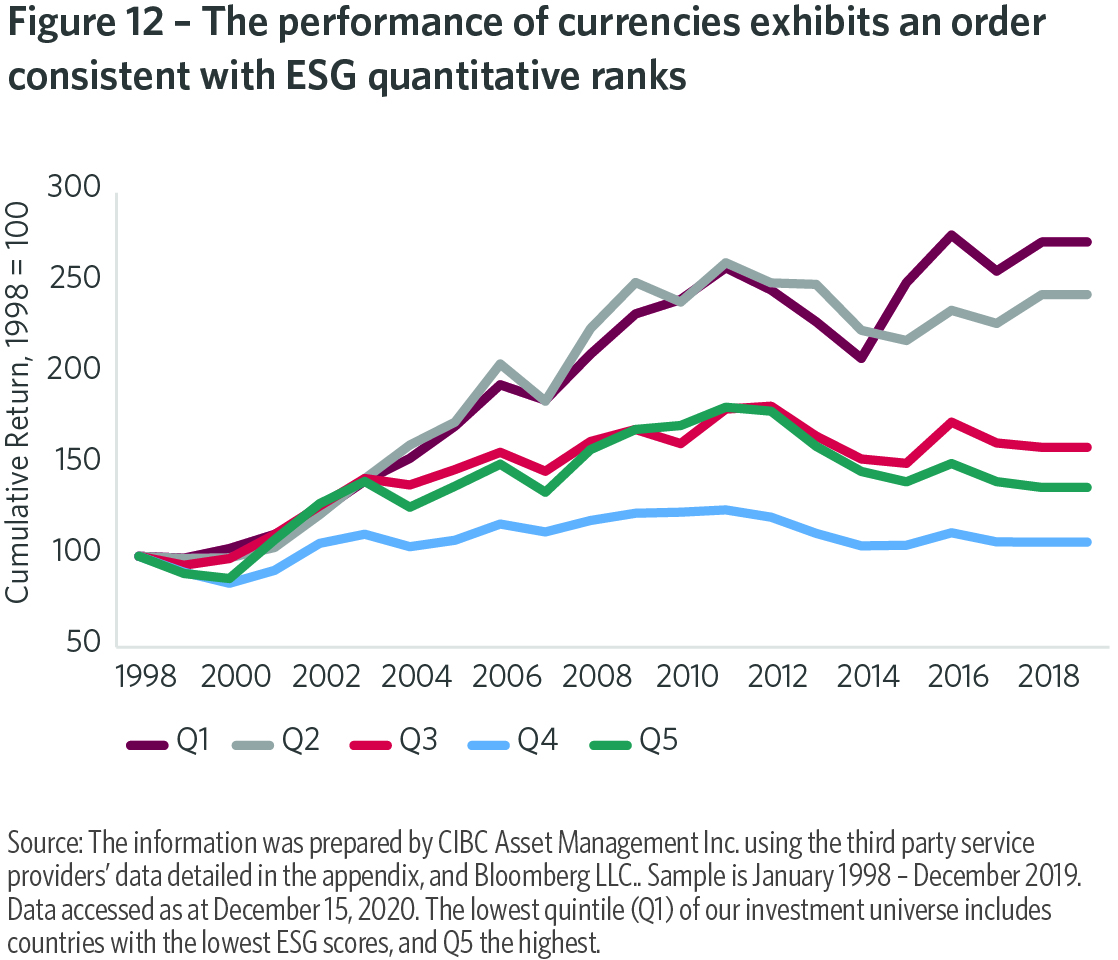
To determine whether quantitative ESG scores have predictive content for future currency returns we construct five active currency portfolios, based on the quintiles of our ranking distribution; the lowest quintile (Q1) includes countries with the lowest quantitative ESG scores in our currency universe, and Q5 the highest. Quintiles are recalculated at the end of each calendar year of our sample, and then maintained through the following year, with subsequent year performance calculated using total currency returns.
The performance order of quintiles is broadly consistent with ESG risk factor additivity (Figure 12). An illustrative Q1/Q5 long/short portfolio would have added substantial value to an active currency investment mandate during the past two decades. As this portfolio does not include our team’s forward- looking fundamental analysis, which has provided significant value-add over a number of years, this result can be considered a base case. It is a strong validation of our proprietary approach to ESG integration.
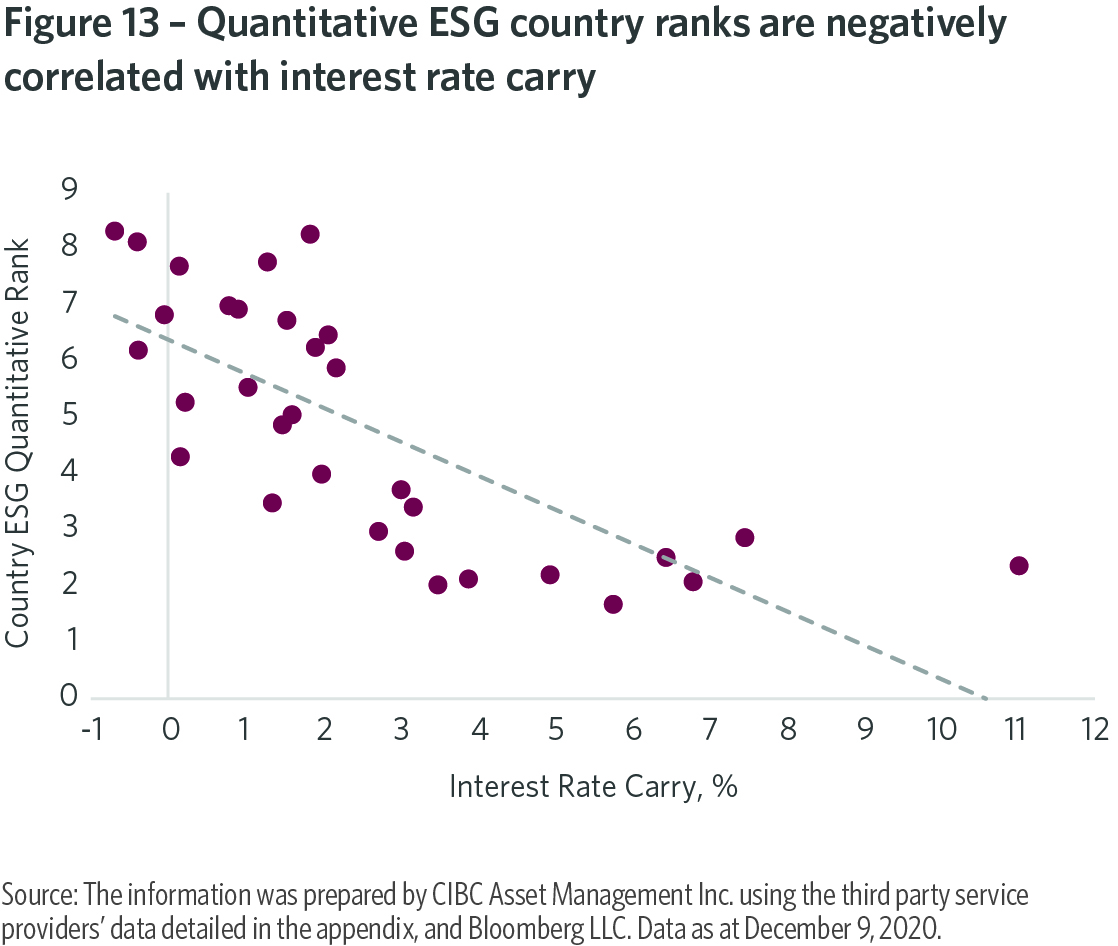
The cumulative performance of our Q1/Q5 portfolio is consistent with an observed negative relationship between country quantitative ESG scores and interest rate carry; countries with the lowest ESG ranks typically exhibit higher carry (Figure 13). Over the long term, by systematically taking a long position in a basket of higher carry currencies funded by a short position in a low carry basket, investors have been rewarded for accepting attendant economic, financial, and ESG risks. Any losses due to currency depreciation have been more than offset by accrued interest, over the long term.
Our results are consistent with the findings of single security equity research reported by Bannier et. al. (2019), and Boffo & Patalano (2020); investors appear to accept lower returns in exchange for exposure to higher-rated ESG assets, suggesting something akin to a safe haven bid.
Is ESG a distinct macro risk factor?
Our results thus far are indicative of a significant relationship between quantitative ESG ranks and currency asset returns. We now seek to determine whether ESG is a distinct macro risk factor, with significant explanatory power for returns once we control for the impact of other identified quantitative risk factors, including Value and Carry.
Intuitively, the answer is affirmative. As constructed, quantitative Value and Carry factors typically measure current investment opportunities, and are less likely to fully discount the future return implications of secular shifts in supply and demand for assets due to ESG policy initiatives and changes in investor preferences.
The extant literature offers mixed evidence, from the perspective of bottom-up security selection. De and Clayman (2015), Cano (2019), Goldman Sachs (2020), and Rockefeller Asset Management (2020) all conclude that ESG is a distinct and additive risk factor. By contrast, FactorResearch (2019) argues that the performance of bottom-up equity portfolios screened according to quantitative ESG criteria actually load on existing risk factors, and particularly Growth; RBC GAM (2019) reaches a similar conclusion.
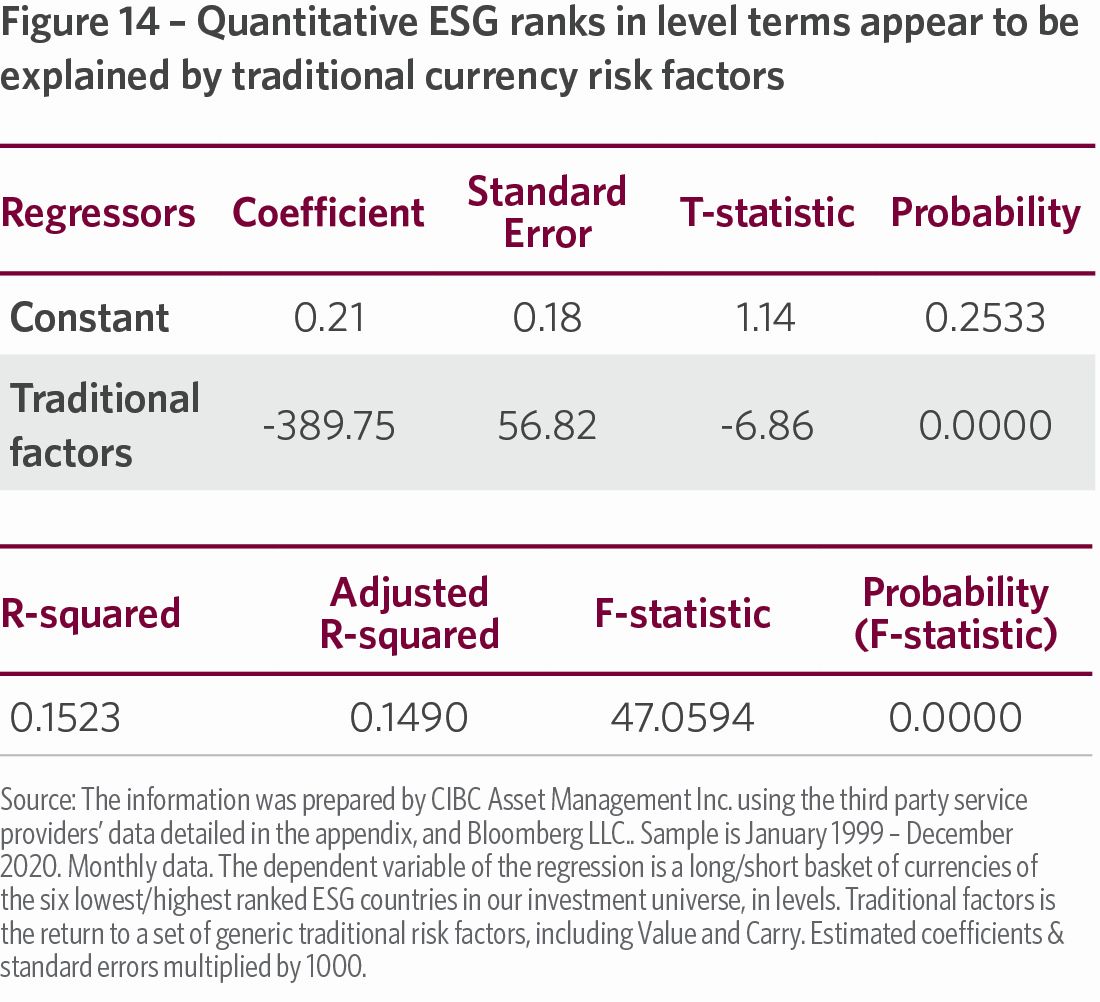
To address this question from a global top-down macro investment perspective, we again focus on our Active Currency investment universe. We construct two long/ short ESG currency baskets including the six highest and lowest ranked ESG currencies, one in levels and the other in 3-year changes. These ESG factor baskets are rebalanced on an annual basis, and used to run a number of regressions, encompassing data over a maximum sample period of January 1999 to December 2020.[8]
First, we regress our long/short ESG factor in levels on a composite of traditional currency risk factors, including Value and Carry (‘Traditional factors’, Figure 14). We find significant evidence that our ESG factor is explained by traditional risk factors. So in level terms, ESG does not appear to be an independent risk factor.
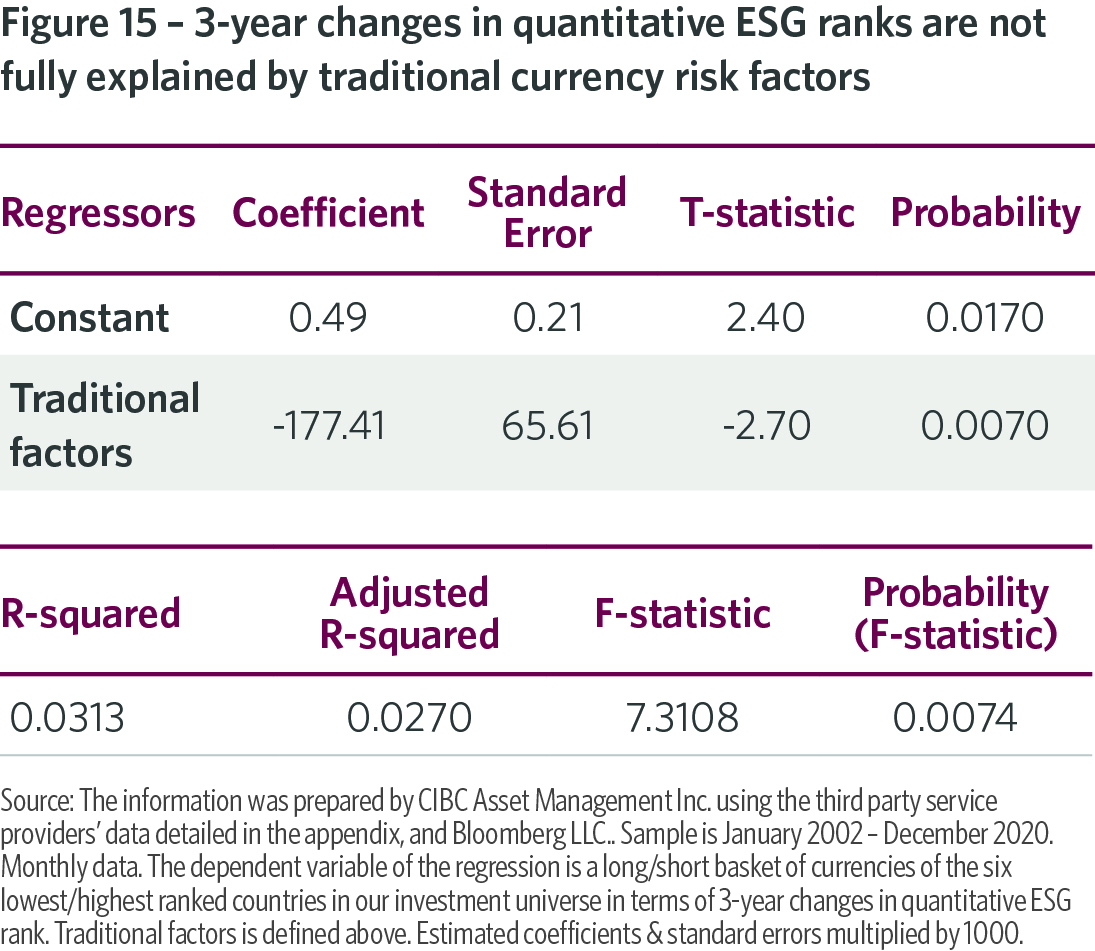
We then perform the same analysis on the 3-year change in our long/short ESG factor (Figure 15). Again, the explanatory power of the composite traditional risk factor variable is significant. But in this case, the constant term is also significant, indicating the presence of omitted information relevant to the behavior of our 3-year ESG change factor beyond the traditional fundamental risk factors. This result is more favorable to the status of ESG as an independent risk factor.
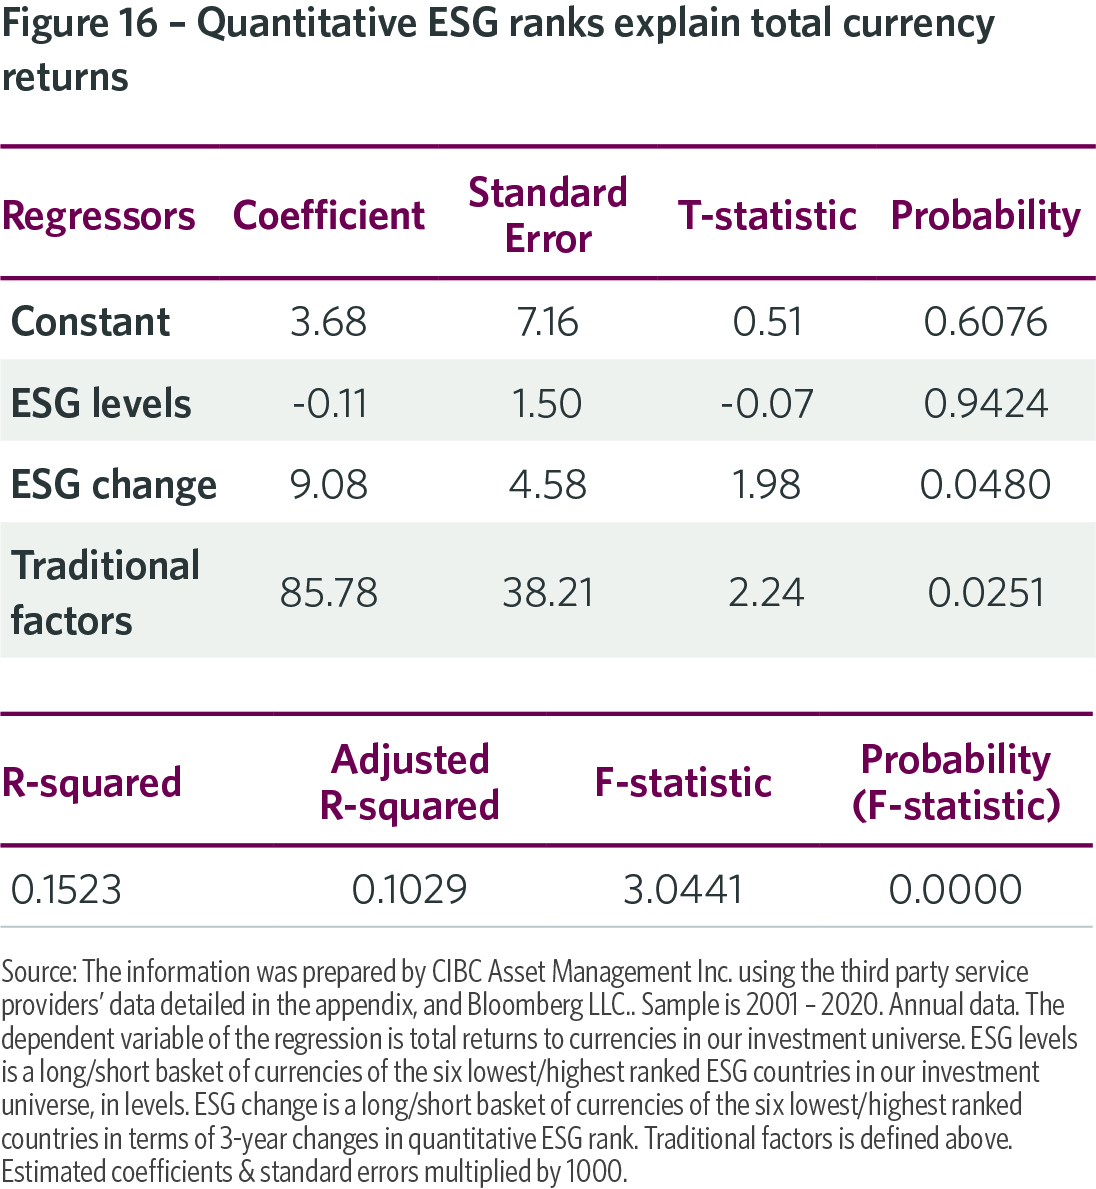
Next, we change our dependent variable to be total currency returns, and regress this variable on both the level and 3-year change in quantitative ESG ranks. We also control for the impact on returns of traditional currency risk factors (Figure 16). We find in favor of statistical significance for the 3-year change in country ESG risk rankings. This explanatory power appears to be independent of the predictive information for returns contained within our traditional fundamental risk factor variable, which is also significant in our regression. This finding again suggests that ESG is a distinct macro risk factor. It further validates the formal integration of ESG risk analysis into our Active Currency investment process.
5. Conclusion
Rigorous ESG integration encompasses two essential elements: analysis and risk assessment; and portfolio construction. In this paper, we detail our approach to both elements in the context of a top-down absolute return Active Currency investment strategy. This sets us apart from the crowd; the focus of most ESG integration efforts has been directed towards bottom-up security selection strategies in equities, Fixed Income, and real assets.
We conclude that E, S, and G risk factors have demonstrable significance for currency returns. This additivity appears to be orthogonal to predictive information inherent in traditional fundamental risk factors, such as Value and Carry. As with these traditional factors, ESG insights can be extracted within an investment framework that integrates foundational quantitative analysis with rigorous forward-looking judgment.
Our investment prior is that rigorous ESG integration is relevant to all top-down macro strategies. We intend to continue to explore this prior, beginning with Global Fixed Income management.
6. References
AQR (2019), Responsible Asset Selection: ESG in Portfolio Decisions.
Bannier, C. E..; Y. Bofinger; B. Rock (2019). Doing Safe By Doing Good: ESG Investing & Corporate Social Responsibility in the U.S. & Europe. CFS Working Paper Series, No. 621, Goethe University Frankfurt, Center for Financial Studies.
Bender, J., T. Bridges, C. He, A. Lester, X. Sun (2017), A Blueprint for Integrating ESG into Equity Portfolios.
Boffo, R., & R. Patalano (2020). ESG Investing: Practices, Progress, & Challenges. OECD.
CalSTRS (2019), Green Initiative Task Force Annual Report. CalSTRS (2020), Investment Policy & Management Plan.
Cano, G. (2019), Factors & ESG: The Truth Behind Three Myths. MSCI Research.
Cerulli Associates (2019a), Environmental, Social, & Governance (ESG) Investing in the United States.
Cerulli Associates (2019b), Responsible Investment in Hedge Funds.
De, I., & M.R. Clayman (2015), The Benefits of Socially Responsible Investing: An Active Manager’s Perspective.
Deutsche Bank (2020), ESG Meets NLP: Systematic ESG Investing.
Deutsche Bank (2021), ESG: Growth, Performance, Biden.
Dunn, J., M. Hernandez, & C. Palazzolo (2020), Clearing the Air: Responsible Investment. Journal of Portfolio Management, 46, 3.
FactorResearch (2019), ESG: What’s Under The Hood?
Friede, G., T. Busch, & A. Bassen (2015) ESG & Financial Performance: Aggregated Evidence From More Than 2000 Empirical Studies. Journal of Sustainable Finance & Investment (5:4), 210-33.
Goldman Sachs (2020), GS Sustain: The PM’s Guide to the ESG Revolution 2.
JP Morgan (2019a), ESG & Global Macro Investing.
JP Morgan (2019b), ESG & Global Macro Investing: Updating Our Top-Down Framework.
Man Institute (2020), ESG Investing: What Does the Research Say?
McKinsey & Company (2020), Institutional Investing in the Time of COVID-19.
Mining.com (2019), Copper, Iron, Bauxite Facing Major ESG Challenges. October 20th.
PRI (2019), A Practical Guide to ESG Integration in Sovereign Debt.
RBC Global Asset Management (2019), Our Perspective On: Is ESG a Factor?
RBC Global Asset Management (2020), 2020 Responsible Investment Survey.
Riedl, A. & P. Smeets (2017), Why do Investors Hold Socially Responsible Mutual Funds? Journal of Finance, 72:2505-50.
Rockefeller Asset Management (2020), ESG Improvers: An Alpha Enhancing Factor.
SASB (2020), Press Release, October 15.
Schroders (2020), Institutional Investor Study.
7. Appendix
Data Sources: Bank for International Settlements; Financial Action Task Force; IFRS Foundation; International Federation of Accountants; International Association of Insurance Supervisors; International Monetary Fund; International Organization of Securities Commissions; The Heritage Foundation; University of Notre Dame; World Bank
[1] Bernard Augustin is Director, Quantitative Research, and Henrilio Julsain is Senior Analyst, in the CIBC Asset Management Multi-Asset & Currency Management Team. Michael Sager is Vice President, Multi-Asset & Currency, in the CIBC Asset Management Institutional Asset Management Team.
[2] Other aspects of CIBC’s commitment under the UN PRI are detailed here: https://www.cibc.com/en/asset-management/investment-solutions/responsible-investment.html
[3] Excluding countries based upon the level of their current ESG rating can seem counterintuitive, as it would penalize lowly ranked low income countries undertaking significant efforts to improve ESG compliance. By making it harder for these countries to raise capital from foreign lenders, a negative screen could reinforce the hurdles to ESG improvement.
[4] Copper supply may also be significantly impacted by growing ESG awareness, for instance due to water and waste risks associated with production (Mining.com, 2019).
[5] The CalSTRS ESG Risk Policy was adopted in 2008, and revised in 2018. It replaced the Statement of Investment Responsibility originally created in 1978 (CalSTRS, 2019).
[6] The Sustainability Accounting Standards Board (SASB) reports licensing agreements with 17 ESG data and analytics providers. Four other providers have worked with SASB to map their data to SASB standards (SASB, 2020).
[7] Defined as the basis point cost of liquidating the entire portfolio within two trading sessions. This is a hypothetical thought exercise, but an important component of portfolio construction.
[8] Again, we caution that the findings of our regression analysis do not incorporate the insights of our forward-looking qualitative analysis that has proven extremely additive to our investment processes over time. So the results we report here should be considered an illustrative base case.

Bernard Augustin, Director, Quantitative Research, Multi-Asset & Currency Management, CIBC Asset Management
Bernard Augustin leads the Quantitative Research group within the Multi-Asset and Currency Management team. Mr. Augustin is responsible for evaluating and enhancing current quantitative research procedures and developing new quantitative tools to help improve the team’s investment processes. He also contributes original ideas and research to portfolio management.
Mr. Augustin joined CIBC Asset Management (CAM) in 2020 with close to three decades of investment management experience. Prior to joining CAM, he held a number of senior roles, including Deputy Chief Investment Officer at Fiera Capital Corporation and Director of Research at Addenda Capital. He also gained portfolio management and research experience at PSP Investments and Ontario Teachers’ Pension Plan.
Mr. Augustin holds an MA in Financial Economics and a BA (Hons) in Economics and Philosophy from Concordia University.

Henrilio Julsain, Senior Analyst, Multi-Asset & Currency Management, CIBC Asset Management
Henrilio Julsain contributes to quantitative research, mathematical models, and programming for the currency quantitative models.
Prior to joining CIBC Asset Management Inc.’s predecessor firm in 2005, Mr. Julsain was Information Systems Security Officer at Banque de la Republique d'Haiti.
Mr. Julsain holds a Master in Mathematical and Computational Finance from Université de Montréal, Master in Applied Mathematics from École Polytechnique de Montréal and Bachelor of Electromechanical Engineering Degree from Université d'Etat d'Haiti.

Michael Sager, Vice-President, Multi-Asset & Currency Management, CIBC Asset Management
Michael Sager is a member of the CIBC Client Portfolio Manager team. Dr. Sager partners with all CIBC distribution channels to deliver targeted thought leadership, education, and investment advice and perspective to clients and consultants.
Prior to joining CIBC Asset Management in 2018, Dr. Sager was an Asset Allocation Consultant at Alignvest Investment Management. Previously, he was a Senior Portfolio Manager at the Canadian Pension Plan Investment Board, a Fixed Income Currency Strategist at Wellington Management, Head of Currency Research at JP Morgan Asset Management and Putnam Investments, and an economist at the European Central Bank and the Bank of England.
Dr. Sager earned a Ph.D. in Economics from the University of Warwick and a Master of Science degree (with distinction) in Economics from the University of London.
