Articles of Interest
Blame the Process, Not the People: Resolving Interdepartmental Challenges Using BPI Strategies

Many Canadian pension funds are looking to find ways to be more efficient in their administration operations. Improvements do not always have to rely on software or technology changes. There are steps that could be taken that would allow organizations to get value out of their current system. One way to accomplish this is to utilize Business Process Improvement (BPI) strategies to solve the process challenges that are inhibiting organizational efficiency.
Most Canadian pension funds have business-related processes that span the whole organization and multiple departments. After working with numerous clients across various sectors, I’ve found that one of the most common process challenges is managing communication and handoff expectations between departments. For example, Disability, Retirement processing usually requires input from multiple departments with very little understanding of the necessary tasks that each department must complete. Canadian pension funds aim to overcome this challenge to improve member service, increase efficiency, and foster better collaboration between departments.
One way to solve this problem is process mapping. Process mapping is a powerful tool for visualizing the sequence and flow of activities within a process, helping teams understand how a process works, and identifying areas for improvement. One of the most striking revelations from process mapping is that staff realize just how intricate, complex, and time-consuming their workflows truly are. When the entire process is laid out visually across a conference room wall or whiteboard, the team is often amazed by the sheer amount of work required to achieve the final output.
I recommend process mapping in two steps by utilizing the:
- Suppliers, Inputs, Process, Outputs, Customers (SIPOC), and then the
- Metric Based Process Mapping (MBPM)
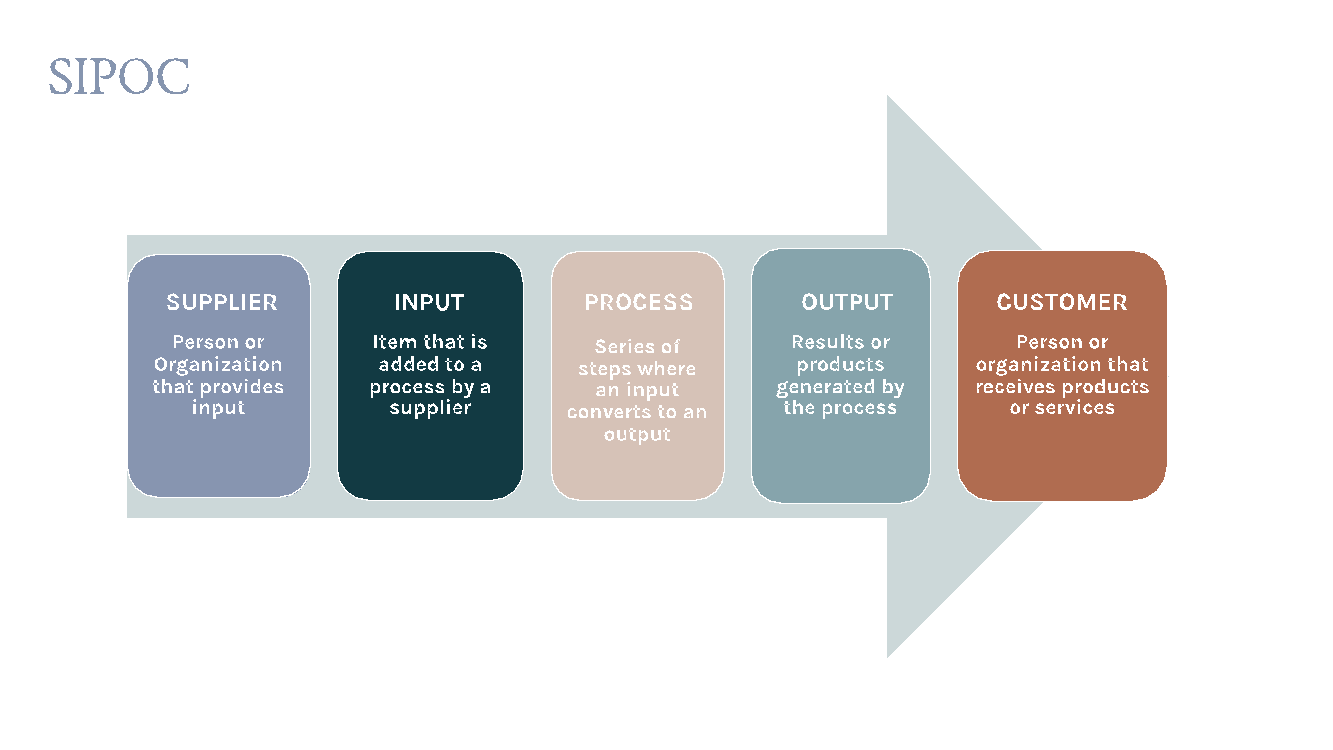
A SIPOC (Suppliers, Inputs, Process, Outputs, Customers) diagram provides a high-level snapshot that helps scope and capture the relationships between different parts of a process. The tool defines the:
- Suppliers: Those providing inputs to the process. (Members, Staff, Employers, Other 3rd Parties)
- Inputs: Items required to execute the process. (Member Physical Documentation, 3rd Party Approvals, Retirement Applications, Spreadsheets)
- Process (start and stop): Steps taken to transform inputs into outputs. (Document 5-7 steps)
- Outputs: Results or products generated by the process. (Payroll, Annuity or Lump Sum Payment, Disability Approval)
- Customers: Recipients of the process outputs. (Members, Retirees, Employers, Beneficiaries and Estates)

There are several reasons why I use and recommend the SIPOC tool. First, it helps identify all customers and stakeholders affected by the process. This ensures that their needs are addressed in the redesign. It’s common to overlook or exclude a critical customer in the original design, leading to service gaps.
Second, SIPOC clearly defines the start and end points of the process. While this may seem minor, in my experience, much confusion and disagreement arise when the process boundaries aren't clear. Members might measure the start and stop points differently, affecting how performance is perceived. For example, a fund member might begin measuring turnaround time when they submit the necessary information, while the organization might not start the clock until the information is complete and accurate, causing delays.
Finally, the SIPOC helps identify key metrics for measuring process performance. By categorizing these into input, process, and output metrics, the team can conduct a thorough analysis and track improvements once the new process is implemented. Typically, additional data collection will be necessary to confirm any assumptions made by the project team. It is not uncommon to have to collect some of the data manually.
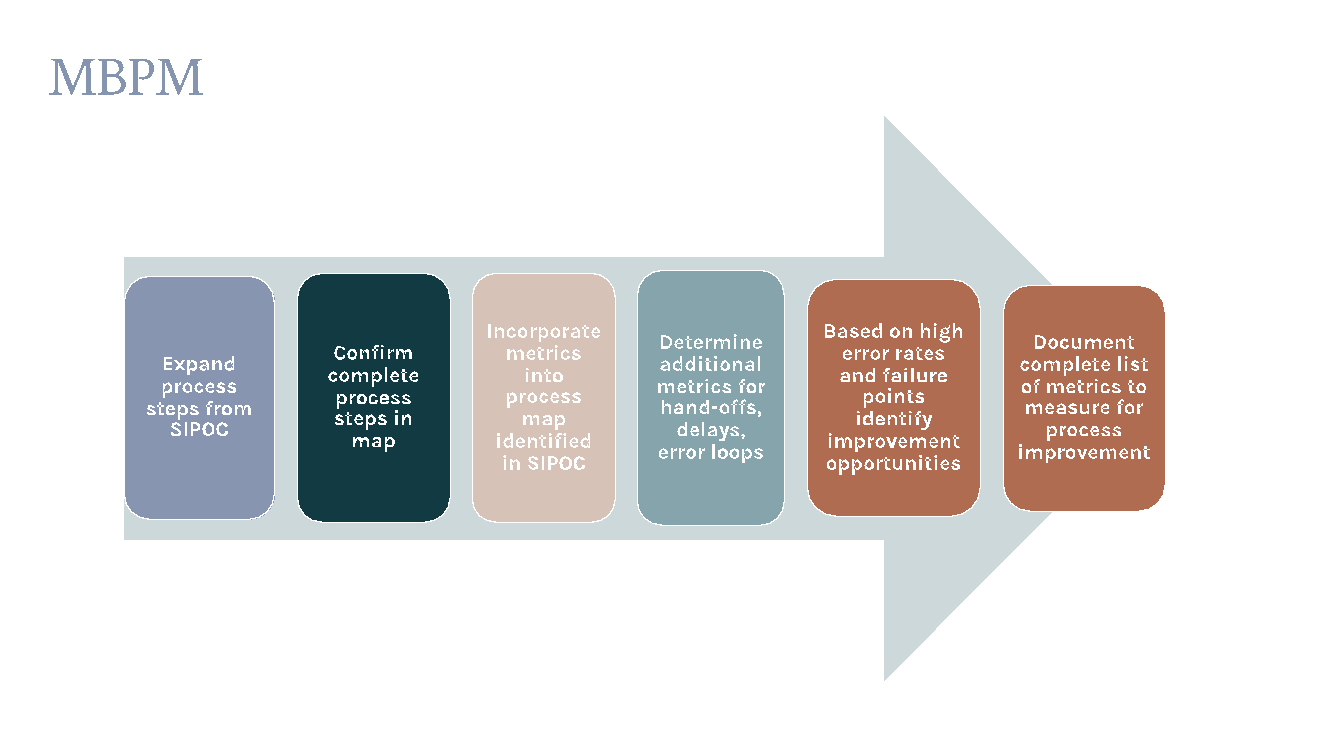
Next, I use a modified version of Metrics-Based Process Mapping (MBPM), a tactical, visual mapping method developed by Mike Osterling and Karen Martin to analyze a process in more detail (Martin, K. & Osterling, M. 2021.). This hybrid approach highlights gaps or challenges in the process, focusing on the steps that offer the biggest potential improvements. For instance, if the organization frequently receives incomplete or inaccurate applications, using data and metrics within the process, the organization can pinpoint areas where resources are wasted, identify bottlenecks, and quantify the frequency and impact of specific issues.
This approach increases the likelihood of success by allowing the team to focus their improvement efforts on the steps in the process that have the most significant impact on performance. By combining visual process mapping with detailed, data-driven insights, MBPM offers a tactical tool for continuous improvement, ensuring that teams aren't just aware of what needs to be done, but have the data necessary to measure and manage performance effectively.

Incorporating tools like SIPOC and Metrics-Based Process Mapping (MBPM) into business process improvement initiatives is crucial for addressing common challenges such as unclear handoff points, process inefficiencies, and overlooked stakeholder needs. These tools provide clarity and focus, ensuring that all parts of a process—from inputs to outputs—are fully understood and optimized.
By defining clear start and stop points and identifying key performance metrics, the SIPOC ensures a solid foundation for process scope, providing clear direction to analyze the process in more detail with the MBPM. The MBPM, with its tactical focus on metrics, enables the team to identify data-driven opportunities that lead to measurable improvements in process performance.
Ultimately, utilizing these process mapping tools equips organizations with the insights needed to drive efficiency, improve communication, and deliver better results across departments. Most importantly, it helps different departments better understand each other’s contributions and challenges to the success of the process. After completion of these projects, staff have a genuine appreciation for the work of all stakeholders. When processes are clear, data-backed, and well-communicated, teams can work together more effectively, leading to operational excellence and improved service delivery.
Reference:
Martin, K. & Osterling, M. (2021). Metrics-based Process Mapping: Identify and Eliminate Waste in Every Process. TKMG, Inc. & Osterling Consulting, Inc., Dallas, TX. https://tkmgacademy.com/products/metrics-based-process-mapping/
Gerard Pappa, Senior Consultant, Linea Solutions

Gerard is a certified Lean Six Sigma Master Black Belt (LSS MBB) with a B.A. in Political Science from the University of Cincinnati and a M.A. in Hospitality Management from the University of Maryland University College. He has over 25 years of customer service and business process improvement (BPI) experience in the hospitality, retail, IT, healthcare, and pension industries.
Currently employed by Linea Solutions as a BPI Specialist, Gerard collaborates with our clients to identify, train, and implement process improvements and strategies to create an organizational framework for continuous improvement. Gerard relishes the opportunity to tackle challenges with a focus on innovation, efficiency, and quality by leveraging Lean Six Sigma and other best practice methodologies.